


Are US Farms Facing a Financial Crisis?
What Farm Income Numbers Have to Say About Farm Household Well-Being and the Need for Government Assistance.
October 7, 2026Over the past five decades, farm interest groups and other commentators have argued that the farm economy is almost always operating under conditions of severe financial stress. For example, on September 14, 2026, the American Farm Bureau Federation, with the support of a wide range of farm interest organizations, released a study arguing that despite improvements in the US Department of Agriculture (USDA) net farm and net cash income forecasts for the 2026 fiscal year, increases in farm input costs are still taking a bite of farm incomes . The report also emphasizes that in nominal terms, the level of sector-wide farm debt has been increasing rapidly since 2020, implying that farms are now facing severe levels of financial stress, skipping over the fact that farm asset values have also increased at about the same rate as farm debts.
Recent increases in diesel and nitrogen fertilizer prices caused by supply-chain disruptions in the Strait of Hormuz have unequivocally been an unpleasant surprise for farms and many other US businesses. Crop prices are also lower for corn, cotton, wheat, soybeans and other row crops than when they were at near-record highs in 2022. This, combined with increases in some input prices, have led to concerns that profit margins and net returns are now negative for some crops and may remain that way for some time. From the farm lobby’s perspective, these two factors have led to suboptimal financial conditions for many agricultural producers.
Farm interest groups also argue that Congress should provide higher levels of funding through those multiyear farm bill programs.
Using USDA Economic Research Service (ERS) estimates of net returns per acre of production, farm interest groups—the American Farm Bureau Federation, the American Soybean Association, the National Corn Growers Association, and other groups—have argued that, as in 2025, in 2026 crop-specific net return estimates will be negative for some crops, including corn, cotton, peanuts, rice, soybeans, and wheat. The associated policy argument is that in the future, farmers will need substantial support from the federal government as ad hoc subsidies, over and above the payments they are likely to receive from long-term prices, income, crop insurance, and conservation and other programs authorized through the farm bill. Farm interest groups also argue that Congress should provide higher levels of funding through those multiyear farm bill programs.
Nonetheless, a more comprehensive assessment than just crop-specific net return estimates is required to determine whether the farm sector is genuinely facing a serious short-term cash flow crisis or a longer-term financial meltdown. On the cost side, net returns estimates include imputed values for the costs of many inputs a farm owns, including returns to family labor, rents for farm-owned land, and farm machinery and building depreciation. Crop-specific net returns estimates, as the USDA has reported, suggest that over the past quarter century on an annual basis, many US farms have frequently operated with negative margins when those margins are estimated using total operating cost numbers that include imputed input costs.
The Farm Sector’s Overall Financial Condition
This partly reflects a healthy livestock sector but also suggests that financial conditions in the agricultural sector are not as dire as some claim.
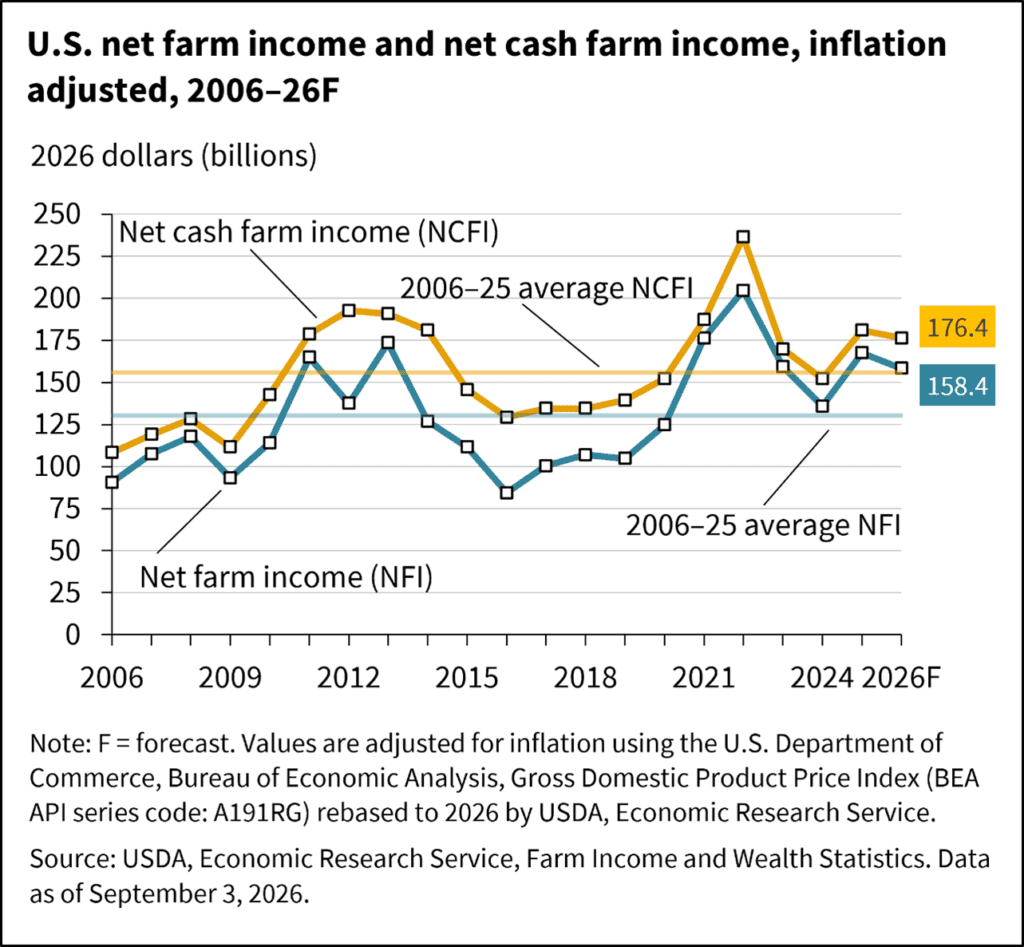
Despite the concerns farm organizations express about negative net returns and recent increases in energy and fertilizer prices, evidence about the broader financial situation presents a paradox. According to the USDA’s September 2026 report on sector-wide financial conditions, overall US net farm income, the difference between total revenues from all sources (including government payments) and total costs (included imputed costs for depreciation, farm family labor, etc.) remains strong. The USDA estimates, in real terms, that both net farm income and net cash income will be above their sector-wide long-run averages in 2026 (see Figure 1). This partly reflects a healthy livestock sector but also suggests that financial conditions in the agricultural sector are not as dire as some claim.
Figure 1. US Net Farm Income Statistics
Source: US Department of Agriculture.
In fact, crop margins, defined as market revenues minus estimated total costs, provide only a partial picture of the overall well-being of farm households. Direct farm program subsidy payments to farmers are predicted to be $47.4 billion in 2026—and much of this sum reflects a significant increase in ad hoc and disaster assistance payments, which are forecast to be $26.5 billion. The rest of these direct government outlays consist of payments associated with standing farm bill programs, such as Price Loss Coverage and Agricultural Risk Coverage. Modified under the One Big Beautiful Bill, these programs will provide even greater support for farmers.
Net income for farmers from the highly subsidized federal crop insurance program should also be considered. Farmers pay only about 30–33 percent of the total premium costs in this program, and thus indemnity payouts significantly exceed their out-of-pocket premium payments. Correspondingly, the Congressional Budget Office estimates that net crop insurance subsidies to farmers—which mostly flow to producers of corn, soybeans, wheat, cotton, and rice—will be $9 billion in 2026 and even higher in future years.
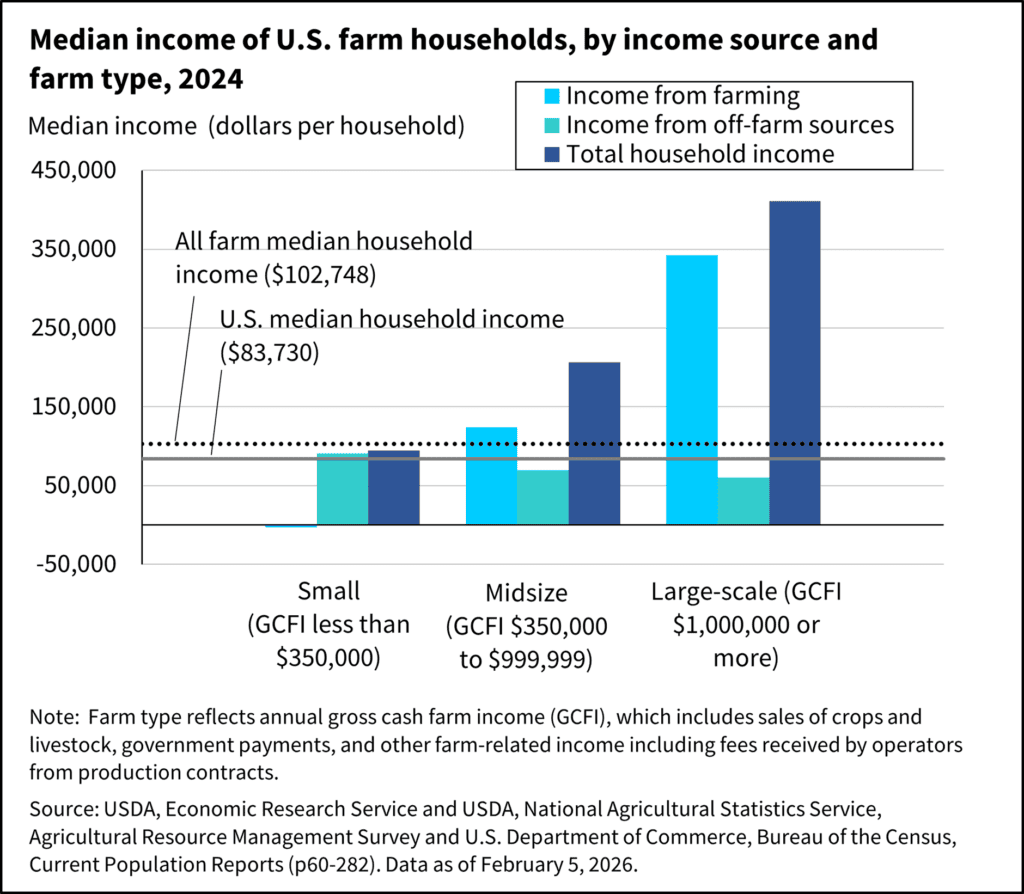
Notably, households that own and operate farms obtain significant amounts of income from off-farm sources. This is true even for large commercial farms with sales above a million dollars.
Additionally, distinguishing between farm income and farm household income is essential in assessing creditworthiness and loan repayment capacity. Farm households typically have higher incomes than non-farm households, even during periods of financial stress. Notably, households that own and operate farms obtain significant amounts of income from off-farm sources. This is true even for large commercial farms with sales above a million dollars. Thus, the actual financial well-being of farm households cannot be accurately assessed by considering only income from farming activities. These households tend to work off the farm for many commonsense reasons, including as a means of diversifying their income sources, managing their overall financial risks, accumulating investment assets (including additional farmland), and securing work-related benefits, such as health insurance and retirement benefits. It is also notable that large commercial farm households, which together produce over 70 percent of agricultural output, have total household incomes that exceed $350,000 per year (see Figure 2).
Figure 2. Median Income of US Farm Households, by Income Source and Farm Type, 2024
Source: US Department of Agriculture and US Department of Commerce.
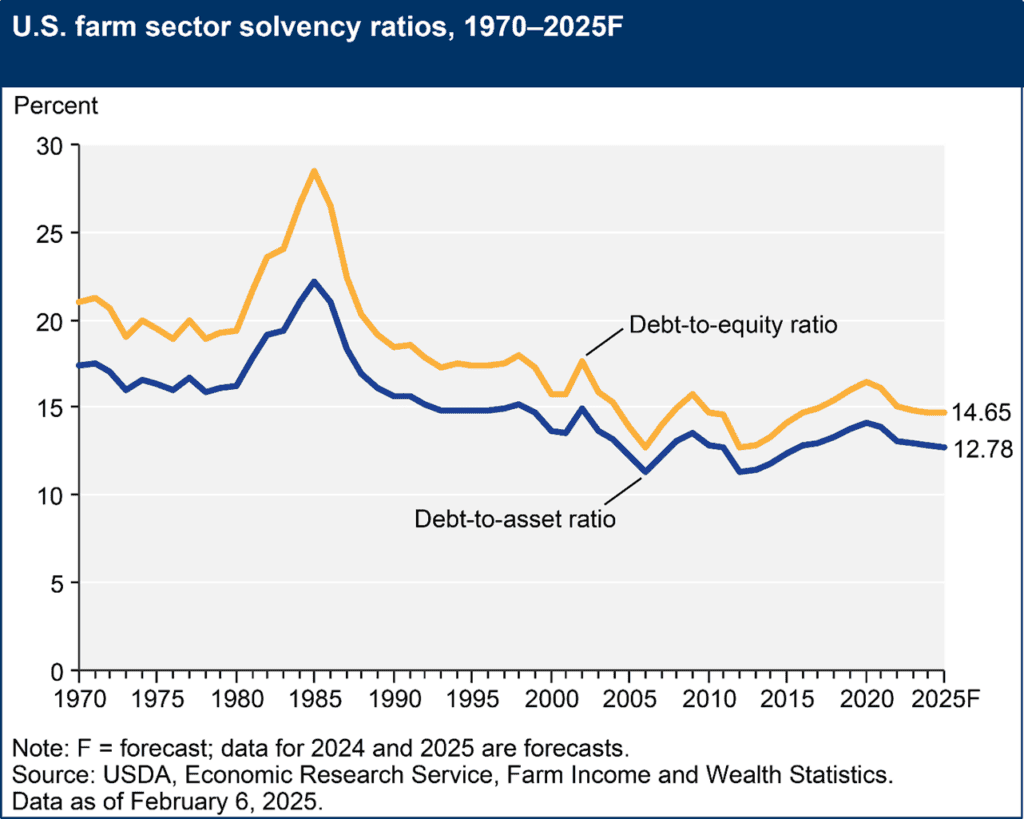
Farm businesses periodically depend on borrowed capital because their annual incomes can vary substantially due to the random nature of farm production conditions. Creditworthiness is an important indicator of the farm sector’s ability to borrow during difficult financial periods when crop prices are low and input prices are high. In recent years, financial hardships have not resulted in any significant increases in the sector-wide debt-to-asset ratio for US farms. Figure 3 shows that this ratio remains low relative to its historical norms and is about 13 percent. Comparatively, this ratio exceeded 22 percent during the farm financial crisis of the mid-1980s—a situation in which many observers suggest the farm sector may shortly find itself. However, for most farmers, borrowing is likely a viable means of coping with short-term financial challenges, given that the current debt-to-asset ratio implies that the sector remains creditworthy.
Figure 3. US Farm Sector Solvency Ratios, 1970–2025
Source: US Department of Agriculture.
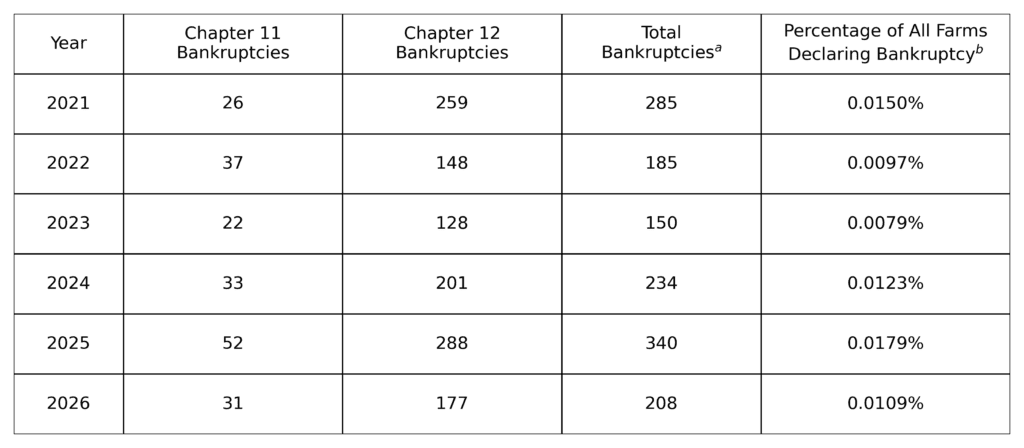
Significant concerns have been raised about the potential for many US farms to enter bankruptcy conditions, but the most recent data do not indicate there have been increases in farm bankruptcy rates. Among US small businesses, 25,796 companies declared bankruptcy over the 12-month period that ended March 31, 2026, representing a bankruptcy rate of 71.26 bankruptcies per 100,000 businesses. In comparison, in 2025, 340 farms declared bankruptcy under either Chapter 11 or 12 of the bankruptcy laws, representing a rate of 16.8 farms per 100,000, and the farm bankruptcy rate has not changed significantly from what it has been in recent years (see Table 1).
Table 1. Farm Bankruptcies, 2021–26
Source: The National Agricultural Law Center and National Association of State Departments of Agriculture, “Data on Economic and Bankruptcy Trends (DEBT): Agricultural Filings in Chapter 11 and Chapter 12,” accessed October 1, 2026.
a The numbers reported in the total bankruptcies column are the sum of Chapter 11 and Chapter 12 bankruptcies.
b The proportion of all farms declaring bankruptcy for each year is the total number of bankruptcies divided by the total number of farms in the United States.
Crop-Specific Evidence on Net Total and Cash Flow Returns
Farms are the classic example of a competitive industry in almost all the markets in which they operate. Even the largest corn or soybean producer provides a minuscule share of the total supply of their commodity to the markets they serve. Over the long run, these businesses earn no persistent excess profits, averaging just enough to cover all the production costs they incur. The estimated net returns for agricultural commodity producers are likely to be close to zero on average, accounting for returns to management (family labor), the imputed costs of using fixed assets of production (farmland, structures, machinery and equipment), and cash outlays on fertilizers, fuel, hired labor, etc. However, on average, cash flows—the difference between a farm’s total revenues and its cash expenditures on input purchases—are likely to be positive.
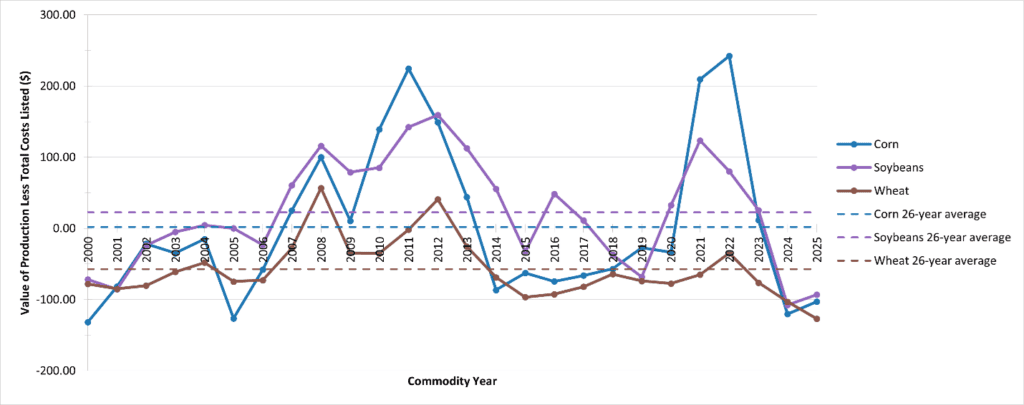
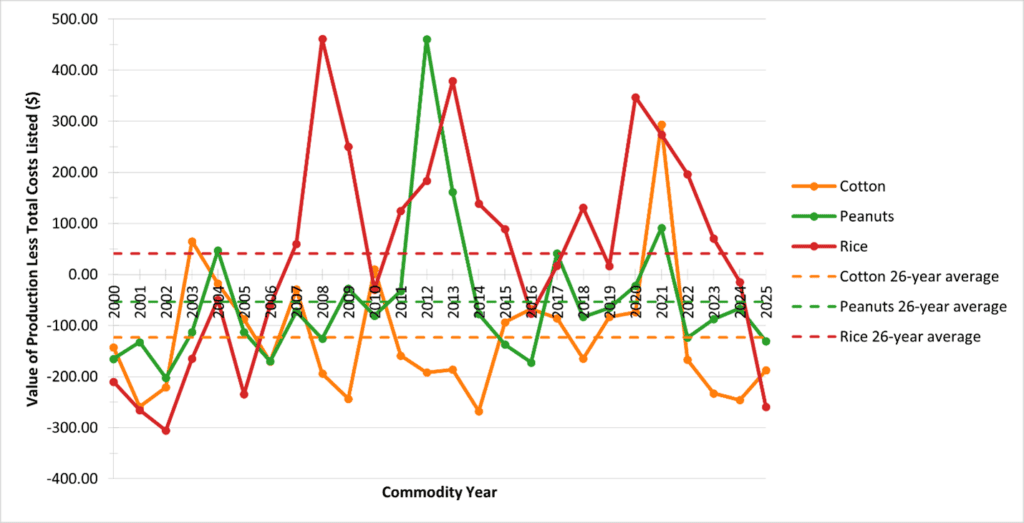
According to USDA ERS data shown in Figure 4, the per-acre annual estimated net return can be volatile for corn, soybeans, wheat, cotton, peanuts, and rice. For example, corn producers had positive and sometimes substantial net returns in 10 of the past 26 years and negative or close to zero net returns in the other 15 years (see Panel A). Similarly, rice growers had positive net returns in 16 years and negative returns in nine years (see Panel B). Net returns for both crops varied substantially from one year to the next and frequently diverged from their average values over the entire period. The net returns reported for the other four crops reflect similar patterns.
Figure 4. Estimated Net Total Crop Returns
Panel A. Corn, Soybeans, and Wheat, 2000–25
Panel B. Cotton, Peanuts, and Rice, 2000–25
Source: Author’s Calculations, US Department of Agriculture.
An important caveat of the average annual net return data is that they do not include the payments farms obtain from federal subsidy programs. Even if such payments are ignored, average per-acre net returns for three of the six crops are positive but either close to zero (about $2 for corn) or relatively modest (about $21 for soybeans and $41 for rice). For the other three crops—peanuts, wheat, and cotton—estimated average net returns per acre have been negative, ranging from average net return losses of about $54 for peanuts and $57 for wheat to about $123 for cotton.
This raises the following question: If these three crops are persistent money losers, then why would any farmer ever plant them at all? At least one part of the answer is that farmers raising those crops receive substantial annual government subsidies through the federal crop insurance and price and income support programs. However, those “non-market” payments are not included the USDA ERS estimates of either the net returns estimates that account for all imputed costs or the net cash return estimates that only include cash outlays for inputs.
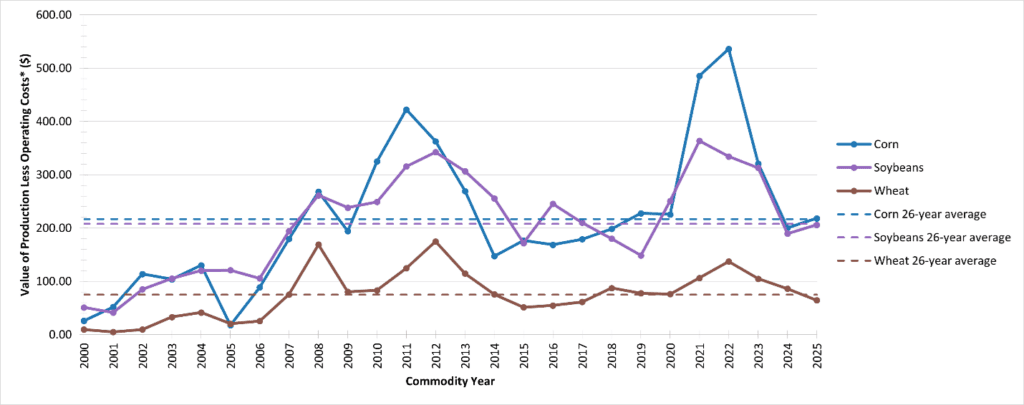
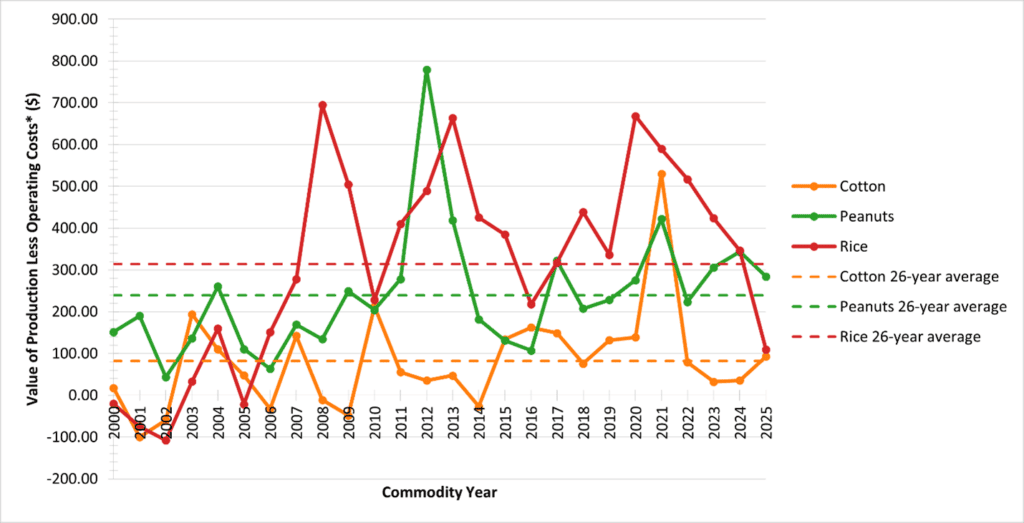
The USDA ERS per-acre annual estimates of net cash returns—total market revenues minus cash expenditures on inputs, excluding imputed values for the opportunity cost of land, family labor, etc.—present a somewhat different picture (see Figure 5). Annual net cash returns for every commodity are also volatile because prices for all those commodities fluctuate considerably from one year to the next. Nevertheless, for corn, peanuts, soybeans, and wheat, those annual average cash flow return estimates are positive in every one of the 26 years from 2000 to 2025 (see Panels A and B). For cotton, the USDA’s net cash return estimates were negative in 2001, 2002, 2006, 2008, 2009, and 2014. However, since 2014, cotton’s annual net cash returns estimates have been positive, even though the estimates do not account for farm bill crop insurance and income and price-support program subsidies. For rice, estimated net cash returns were negative in 2000, 2001, 2002, and 2005, but returns were positive in all other years (see Panel B). Additionally, average annual per-acre net cash returns, excluding those imputed input costs, for each crop have been positive and relatively substantial, ranging from about $75 to $314.
Figure 5. Estimated Net Cash Returns
Panel A. Corn, Soybeans, and Wheat, 2000–25
Panel B. Cotton, Peanuts, and Rice, 2000–25
Source: Author’s Calculations, US Department of Agriculture.
Summary
Running a business in any highly competitive market where the company has little ability to control input and output prices is always challenging—whether the business is a dry-cleaning operation, a restaurant, an Iowa farm raising corn and soybeans on 5,000 acres of cropland, or a 15,000-acre North Texas operation growing cotton and wheat and raising a few hundred head of cattle. Such businesses are usually only successful when the management maintains product quality and controls its costs by using resources efficiently and judiciously. However, such businesses’ profit margins and, equivalently, net returns will always be at the mercy of market-wide price movements for the commodities they sell and the inputs they use. Moreover, because the supply side of their industry is competitive, well-managed firms and farms will not enjoy large returns or persistent losses on a long-term basis when all sources of revenue are considered.
Nevertheless, at the sector-wide level, there is little support for many farm interest group claims that farm incomes have been so poor in 2024 and 2025 that the sector is on the verge of a major financial crisis.
The evidence presented here with respect to the agricultural sector’s financial variability over the past two decades is consistent with the perspective that farms, taken as a whole, will enjoy financially rewarding years as well as financially disappointing years. Nevertheless, at the sector-wide level, there is little support for many farm interest group claims that farm incomes have been so poor in 2024 and 2025 that the sector is on the verge of a major financial crisis. Certainly, net farm income and net cash income were lower in 2024 and 2025 than in 2023, a year of relatively high crop prices and a near-record levels of net farm income. However, at around 13 percent in 2025 and 2026, the sector-wide debt-to-asset ratio has remained close to its record low and is much lower than levels associated with the last significant farm financial crisis of the 1980s. Furthermore, in recent years, including 2025 and 2026, farm bankruptcies have been infrequent, and most farms file Chapter 12 bankruptcies, which allow them to reorganize debts and continue to operate.
At the individual crop level, the USDA ERS provides estimates of total net returns and net cash returns for individual crops. Over the 26-year period from 2000 to 2025, average annual total net returns for corn, rice, and soybeans were positive but close to zero; for cotton, peanuts, and wheat, returns were negative. However, farmers raising all six crops regularly received large federal crop insurance and price and income-support program payments over that period. Further, annual net cash flows were positive in every year for four of the six crops—corn, peanuts, soybeans, and wheat—and positive in most of the 26 years for cotton and rice. Moreover, over the 26-year period, average annual net cash returns have been positive and relatively substantial for all six commodities.
These findings are also consistent with the view that while farm businesses are being buffeted by the impacts of higher prices for energy and other inputs due to the war with Iran, most of those farms remain financially sound. In fact, farms and the families that own and operate them are well situated to manage the impacts of higher energy and other costs by themselves without substantial injections of additional federal subsidies for at least three reasons. First, prices for major crops such as corn, wheat, and soybeans have been increasing over the past few months. Second, if farms need short-term infusions of funds to manage their operations, they are also likely to be creditworthy and in a good position to obtain such loans from financial institutions. Third, on a short-term cash flow basis, because net cash returns for most major crops have been positive over the past two years and most farm households have substantial revenue streams from other sources—such as off-farm employment, social security, and investment returns—most farm-owning families appear to be in a strong position to cope with short-run adverse movements in the incomes they obtain from their farms.
Certainly, current financial conditions in US agriculture are not altogether favorable for some farmers, as production costs are relatively high and cash prices for some crops relatively low. However, the sector as a whole remains financially strong. The resolution of the ongoing conflict with Iran will have important implications for long-run financial conditions in US agriculture, whether the outcome is a return to a regime of lower diesel, gasoline, and fertilizer prices or a continuation of supply constraints and higher prices for those critical farm inputs. Although most farmers purchased fertilizer ahead of the conflict, mitigating the cost impacts of the Iran crisis for the current crop year, the degree to which fertilizer and other input prices remain high will be an important factor for production costs and farm incomes in a new crop year. Nevertheless, while the current challenges facing the agricultural sector are significant, perhaps especially with respect to input costs, the sector can manage them by itself, without relying on substantial one-off federal financial bailouts.
Vincent H. Smith is a nonresident senior fellow and the director of agricultural policy studies at the American Enterprise Institute. He is also a professor emeritus at Montana State University.
Barry K. Goodwin is a nonresident senior fellow at the American Enterprise Institute and the William Neal Reynolds Distinguished Professor in the Department of Agricultural and Resource Economics in the College of Agriculture and Life Sciences at North Carolina State University.
Special thanks to Shantanu Kamat for contributing to the piece.