
A Preliminary Macroeconomic Analysis of the “One Big Beautiful Bill Act” (OBBBA)
Assessing the long-run impact of the proposed taxes on the supply of labor and capital.
June 12, 2025Key Points
- The OBBBA extends major portions of the 2017 Tax Cuts and Jobs Act, enacts a handful of Trump’s campaign proposals, and enacts several offsets that raise taxes and reduce federal spending.
- The law would impact incentives to work, save, and invest. However, the effects would be mixed and vary over the next decade and over the long run.
- Ignoring the impact on federal borrowing on the economy, the OBBBA would boost long-run economic output by 1 percent by increasing the supply of labor and capital.
- Considering the impact of borrowing, the OBBBA would increase economic output by 0.5, on average, over the next decade, but the impact would decline over time due to expiring tax provisions and the impact of federal borrowing on private investment.
- The higher output over the budget window would result in modest dynamic revenue feedback of $332 billion over a decade. This would reduce the federal government’s revenue loss due to the OBBBA from $4.47 trillion to $4.13 trillion over the next decade and reduce bill’s net deficit impact from $3.25 trillion to $2.92 trillion over the next decade.
Introduction
On July 4, President Donald Trump signed the “One Big Beautiful Bill Act” (OBBBA) into law. The OBBBA extends and enhances the expiring provisions of the 2017 Tax Cuts and Jobs Act (TCJA), introduces a handful of President Trump’s campaign tax proposals, and offsets some of the cost of these tax cuts with tax increases and spending reductions.
Tax policies generally impact the economy in three ways. In the short run, changes in taxes can change the after-tax resources available to households, which can impact the demand for goods and services. In the long run, taxes impact economic output by influencing the supply of labor and capital. Finally, changes in federal borrowing can affect the broader economy by impacting investment or foreign claims on future US output.
The OBBBA, by changing the after-tax returns to work, saving, and investment, will have an impact on the US economy in the short run and the long run. These macroeconomic effects are important to consider because they have direct effects on households and the federal government’s finances.
This paper produces two estimates. The first focuses on the long-run impact of the OBBBA’s tax changes on economic output. As such, it considers how changes to the marginal tax rate on labor affect the after-tax wage and labor supply and how taxes on capital affect the cost of capital and the long-run size of the capital stock. This long-run analysis assumes that changes in government borrowing are entirely offset with non-distortive tax increases or spending reductions. This is perhaps unrealistic, but it isolates the impact of tax changes on the economy.
The second analysis estimates the average increase in output over the 10 years following the passage of the OBBBA. In contrast with the long-run estimate, this estimate incorporates the impact of additional borrowing over the budget window and its impact on interest rates, the capital stock, and economic output. This estimate is combined with a revenue estimate from the Joint Committee on Taxation (JCT) and spending projections by the Congressional Budget Office (CBO) to produce a dynamic budget score.
Major Components of the OBBBA
The core of the OBBBA is permanent extension of most of the major individual income tax provisions of the TCJA. This includes the lower statutory tax rates, the reformed family benefits, higher alternative minimum tax and estate and gift taxes exemption thresholds, limitations on the state and local tax (SALT) deduction and the home mortgage interest deduction, and Section 199A, the deduction for qualified business income.
The OBBBA makes a handful of changes to the individual provisions of the TCJA. It permanently enhances the standard deduction, the child tax credit, and estate and gift tax exemption threshold. It makes reforms to Section 199A deduction. It temporarily increases the SALT deduction limitation from $10,000 to $40,000 with a phase-out for high-income households. It also replaces the Pease limitation on itemized deductions with a new limitation that caps the tax value of deductions for high-income households at 35 percent.
The law includes three of President Trump’s individual income tax cut campaign promises. It introduced a new $6,000 deduction for seniors and limited deductions for tips and overtime for qualifying workers. Finally, up to $10,000 in interest paid on qualifying auto loans is deductible against a taxpayer’s adjusted gross income.
It also permanently extends 100 percent bonus depreciation, reverses amortization of research and development, and loosens the limitation on net interest deductions. It introduces temporary expensing for certain qualifying manufacturing structures.
The OBBBA extends and modifies the three major international tax provisions introduced by the TCJA: global intangible low-tax income, the foreign derived intangible income, and the base erosion anti-abuse tax. The tax rates on all three of these provisions would rise from their current policy levels.
In addition to these major provisions, the bill introduces dozens of smaller provisions, such as an above-the-line deduction for charitable contributions, floors for the corporate and individual deduction for charitable contributions, and expansions to “ABLE” accounts and HSAs and introduces what are called “Trump Accounts” for households with children. The OBBBA repeals most of the Inflation Reduction Act tax credits for green energy investments and consumer goods. It also tightens eligibility for several tax credits for low-income households.
Impact of OBBBA on Work Incentives
On net, the OBBBA would improve work incentives. It would increase after-tax wages by reducing the marginal tax rate on labor earnings. However, the effect would vary over the next decade.
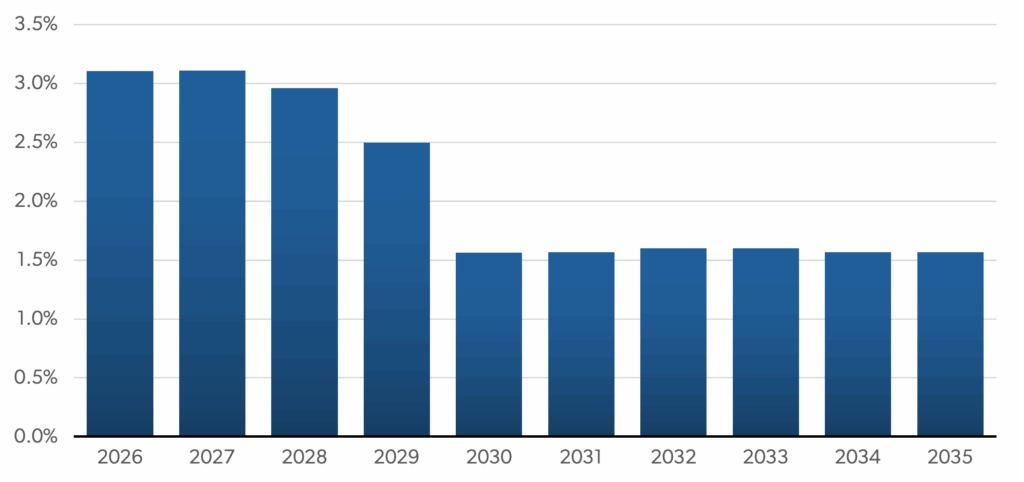
Figure 1 shows the percent change in the economy-wide after-tax wage rate. This represents the change in the returns to work. From 2026 to 2028, the OBBBA would increase the after-tax wage rate by between 3.1 and 3.0 percent. After the expiration of the Trump campaign proposals and the $40,000 SALT cap, marginal rates would rise slightly but still be lower than under current law. As such, the OBBBA would increase the after-tax wage rate by 2.6 percent in 2029 and 1.6 percent between 2030 and 2035 and in the long run.
Figure 1. Percent Change in the After-Tax Wage Rate
Source: Author’s Calculations
The most important provision that reduces marginal tax rates is the across-the-board reduction in statutory tax rates, which permanently increases the after-tax returns to work. In addition, the Trump campaign proposals to exempt overtime, tips, and the deduction for seniors would all marginally increase after-tax wages. However, these provisions expire in 2029.
A handful of changes, in isolation, increase marginal tax rates. For example, changes to itemized deductions. Under current law, the net marginal tax rate on work is the sum of federal, state, and local taxes, net of the deduction for SALT. The OBBBA, however, caps the SALT deduction ($40,000 from 2025 until 2029 and $10,000 from 2030), reduces the generosity of the home mortgage interest deduction, and increases the standard deduction. As a result, many taxpayers can no longer deduct state and local income taxes at the margin, raising their net state and local income tax rate.
Impact of OBBBA on Investment Incentives
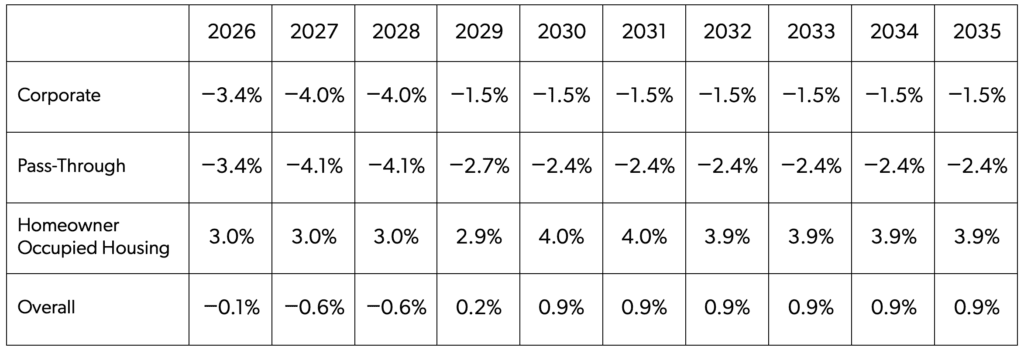
The impact of the OBBBA on the incentive to invest also varies over the budget window. The table, below, shows the percent change in the service price of capital for private capital: C corporations, pass-through businesses, and homeowner occupied housing. The service price of capital represents the minimum gross return required for a new investment to break even. The service price represents the cost of new investment and changes in the service price influences the incentive to invest.
Over the budget window, the OBBBA has mixed effects on the incentive to invest in private assets. In the first three years (2026 through 2029), private businesses (C corporations and pass-through businesses) will see a significantly lower service price—a reduction between 3.4 percent and 4.1 percent). This is due primarily to 100 percent bonus depreciation, expensing of research and development, the loosening of the net interest deduction limitation, and expensing of manufacturing structures. Once the expensing of structures expires after 2029, the service price of capital will be 1.5 percent lower for C corporations. In contrast, pass-through businesses permanently see a 2.4 percent lower service price due primarily to the permanent extension of the lower statutory tax rates and Section 199A.
Homeowner-occupied housing, in contrast, will face a tax increase throughout the budget window. OBBBA tightens the cap on home mortgage interest, caps the SALT deduction, and generally reduces the share of households itemizing their deductions. As a result, fewer taxpayers will deduct interest on mortgages and property taxes, increasing the cost of investing in new homes.
Table 1. The Impact of OBBBA on the Service Price of Capital, by Major Sector
Source: Author’s Calculations and Tax Calculator Version 4.6.0.
The OBBBA would also marginally improve the incentive for households to save. This is due to marginally lower statutory tax rates on interest income (due to the statutory tax rate cuts) and a small expansion of tax preferred savings accounts. Higher saving will marginally reduce the required return on new investment. However, these effects are not incorporated in the above service price estimates.
Long-run Macroeconomic Implications
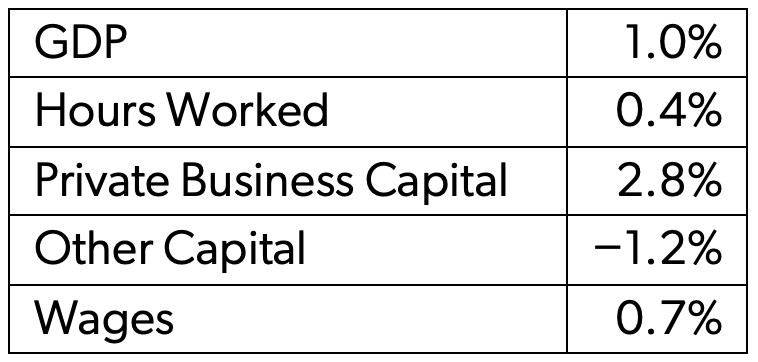
On net, the OBBBA’s impact on incentives to work and invest would increase long-run economic output (Table 2). As such, the level of gross domestic product (GDP) will be 1 percent higher than it would otherwise be. The higher output would be due to both a 0.5 increase in hours worked by individuals, which is equivalent to 495,278 full-time equivalent jobs and a larger capital stock. As discussed above, the OBBBA would reduce the service price of capital for private business assets but increase the service price for homeowner occupied housing. This would result in a 2.8 percent larger private business capital stock, but a 1.2 percent smaller stock of all other capital. The increase in the private business capital stock would result in an increase in labor productivity in the long run. As a result, pretax wages would rise by 0.7 percent.
Table 2. Long-Run Macroeconomic Impact of the OBBBA, Ignoring Impact of Debt.
Source: Author’s Calculations
Note that the long-run analysis isolates the impact of tax changes on the economy and, effectively, assumes that the federal deficit is held constant. As such, it does not incorporate the impact of federal borrowing on investment, saving and economic output. However, it can be directly compared to similar analyses by Tax Foundation (2025) and the Council of Economic Advisors (2025).
10-Year Macroeconomic Impact and Dynamic Revenue Estimate
The OBBBA will also affect economic output within the budget window. As discussed above, OBBBA’s impact on incentives differs across the budget window, providing a larger incentive to work, save and invest in the first five years than the second five years. Furthermore, the OBBBA, as written impacts budget deficits over the next decade—increasing borrowing by $3.2 trillion (before considering interest on the debt and macroeconomic feedback). Federal borrowing will result in some combination of a reduction in domestic investment or increase in foreign holdings of US assets, ultimately reducing output or national income.
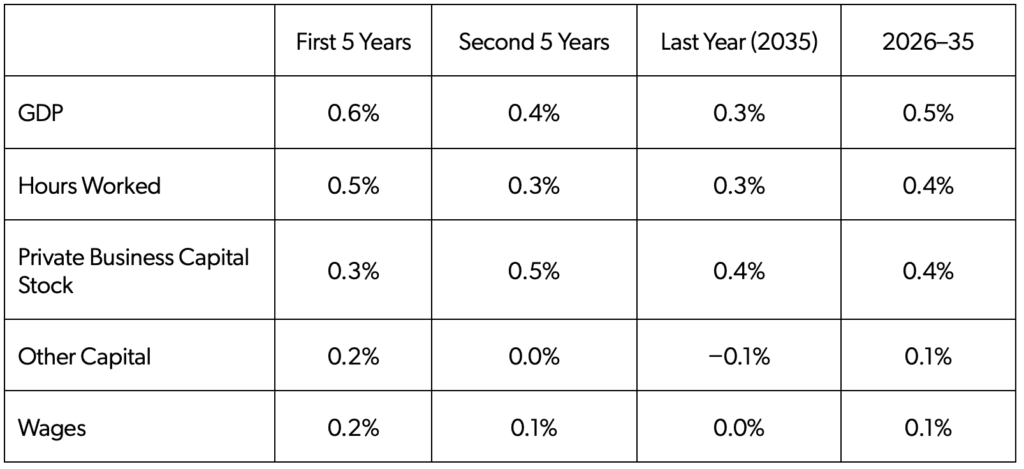
The OBBBA would have its largest impact on output in the first five years of the budget window (Table 3). On average, the level of output (0.6 percent), labor supply (0.5 percent), the private business capital stock (0.3 percent) and wages (0.2 percent) would be higher than it would otherwise be in the absence of the OBBBA. This is primarily due to the business provisions in the bill that reduce the cost of capital for private businesses significantly.
Table 3. Macroeconomic Impact of the OBBBA Between 2026 and 2035
Source: Author’s Calculations
In the second half of the budget window, the OBBBA’s impact on the economy would begin to wane. Output, for example, would be 0.4 percent higher than otherwise. This is due to three factors. First, marginal tax rates on work would rise as Trump’s campaign proposals (tips, overtime, etc.) expire and the SALT deduction falls to $10,000. Second, the cost of capital rises as expensing for qualified production structures would expire and the tighter SALT cap raises taxes on homeowner occupied housing. Third, additional federal borrowing would begin to raise interest rates, further increasing the cost of capital.
The economic impact of the OBBBA will continue to fall by the end of the budget window, although the economic impact will remain generally positive. Output and hours worked are projected to be 0.3 percent higher than baseline by 2035. The private business capital stock would remain 0.4 percent higher than baseline, but other capital (primarily homeowner occupied housing) would be 0.1 percent lower. Wages would be unchanged at the end of the decade.
The additional output over the next decade (an average increase of 0.5 percent) would modestly broaden the income and payroll tax base, resulting in offsetting dynamic revenue gains. According to the JCT, the OBBBA would reduce revenue by $4.4 trillion between 2025 and 2034. Additional revenue produced by economic growth, discussed above, would offset $310 billion in revenue losses over the next decade, resulting in a net reduction in federal revenue of $4.13 trillion. After incorporating the spending reductions in the bill, the net cost, after economic growth, is projected to be $2.92 trillion over a decade.
Table 4. Conventional and Dynamic Primary Deficit Impact of the OBBBA
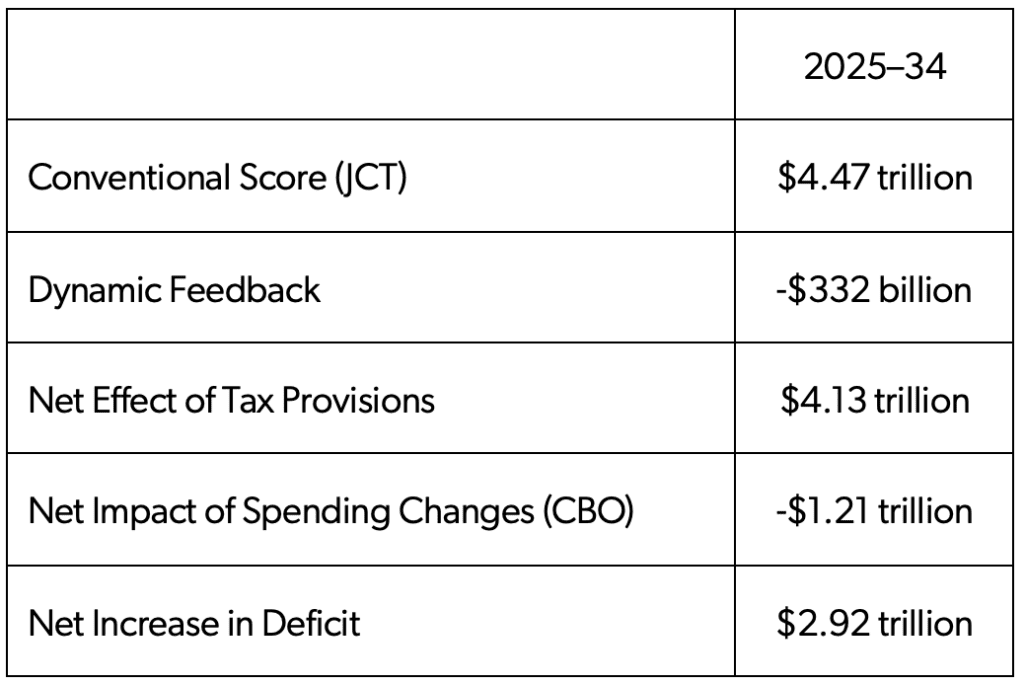
Source: Author’s Calculations, Joint Committee on Taxation, and Congressional Budget Office.
Brief Overview of the Methodology
The model used to produce these estimates is the same used in a 2024 Kyle Pomerleau and Donald Schneider report. The model is a comparative statics model of the US economy. The model uses a Cobb-Douglas production function with constant returns to scale. The model includes six sectors: general government, C corporate businesses, pass-through businesses, households, nonprofits, and government enterprises.
Changes to the long-run size of labor supply is a function of the after-tax wage rate. The after-tax wage rate is the average pretax wage reduced by the weighted average marginal tax rate on wages and salaries. The model uses a labor supply elasticity consistent with the Congressional Budget Office of 0.24—which assumes that labor supply rises by 0.24 percent for each 1 percent increase in the after-tax wage rate.
Changes to the long-run size of the capital stock are a function of the service price of capital. The service price of capital is the minimum pretax gross return required to break even in present value on new investment. The service price is equal to the sum of the pretax return demanded by shareholders and economic depreciation, grossed up by any entity-level taxes on investment.
In modeling changes to the capital stock, the model assumes that the US economy is a large, open economy. This is modeled by blending two modeling approaches: a perfectly open economy and a closed economy. For the open-economy simulation, the after-tax return on investment (before shareholder taxes) is assumed fixed in the long run. For a closed economy simulation, the after-tax return (and thus the service price and the size of the capital stock) are a function of the savings rate. Private saving as a share of national income is a function of the after-tax return on saving. The model assumes that a 1 percent increase in the after-tax return on saving leads to a 0.2 percent rise in saving as a share of national income. For the final simulation, the two pretax returns are blended (80 percent fixed, 20 percent determined by the savings rate) to determine the firm’s discount rate in the service price.
For the budget window analysis, the model assumes that the capital stock adjusts to its long-run desired level at 5 percent per year. The model also assumes that a 1 percent increase in debt as a share of GDP increases interest rates by two basis points.
Marginal tax rates on various sources of income (wages salaries, pass-through business income, interest, dividends, and capital gains) were estimated using Tax Calculator version 4.6.0. Other parameters used to calculate the tax burden on saving and investment are consistent with those in a Pomerleau report published in 2020.