
The National Assessment of Educational Progress: “Gold Standard” or Lead Anchor?
The Trump administration has an opportunity to modernize America’s standardized tests and help millions of students.
February 25, 2026American classrooms are constantly chasing the next education innovation, but left out of this process have been the tests we use to measure our students’ success. Every two years, the release of student achievement data from the National Assessment of Educational Progress (NAEP), often called the “gold standard” of educational testing, drives headlines on the state of American learning. Given the United States’ decentralized education system, NAEP’s biennial releases are the best-available national barometer of American education.
The assessment is considered so important that even officials in the Trump administration’s Education Department, who have been actively working to abolish their own department, have no plans to discontinue it.
Despite its critical role, NAEP is outdated, and its data are far too difficult to access and use. These two issues stem from the same cause: A handful of contractors—among them Pearson, Westat, and, most importantly, the Educational Testing Service (ETS)—have been steering NAEP for years. The power of this troika has stymied efforts to modernize NAEP in ways that would reduce costs and deliver more meaningful data to more stakeholders.
Ultimately, though, it’s not contractors but the federal government that is at fault. The National Center for Education Statistics (NCES) leads and manages NAEP contracts. It can and should require its vendors to modernize and become more useful to the American public. The Trump administration is uniquely positioned to do this.
To understand the options at the Trump administration’s disposal, we must first trace the history of how NAEP came to represent some of the worst of federal contracting.
What Is NAEP, and How Does It Work?
NAEP is overseen by two government entities. Its policies and testing schedule are overseen by the independent and nonpartisan National Assessment Governing Board (NAGB), a panel of 26 members appointed by the secretary of education. Members are chosen to represent a cross section of interests, including governors, testing experts, business representatives, teachers, and the public. The operational and technical aspects of NAEP fall under the purview of NCES, a federal statistical agency.
NAEP began testing students in 1969 to provide the nation a better picture of student ability. Since the 2001 No Child Left Behind Act, NAEP has tested fourth and eighth graders on reading and math every two years, 12th graders on reading and math every four years, and a handful of other subjects (including science, civics, and US history) roughly every four years.
Because it covers so much material, NAEP is too big for any single student to take in its entirety.
NAEP tests lots of students: In 2024, around 450,000 fourth and eighth graders took the reading and math tests. However, NAEP’s structure is different from that of better-known end-of-year state assessments. While a state tests all its students, NAEP selects a nationally representative sample of schools and tests a sample of students in those schools. Further, while state tests are geared to that state’s learning standards, NAEP, as a national assessment, must test across a much wider range of curricular topics.
Because it covers so much material, NAEP is too big for any single student to take in its entirety. Instead, each student answers only a subset of the test’s questions. NAEP then uses statistical tools to combine student performance into estimates at the national and state levels, broken down by subgroups such as race, sex, and income. These tools were pioneered by the late Robert Mislevy of ETS in the 1980s and 1990s, when they were considered cutting-edge. Forty years later, this cutting-edge design has become dull.
Members of the NAEP industrial complex often call it the gold standard because that moniker lends the test cachet as the nation’s premier assessment. Perhaps it was its self-regard as the gold standard that blinded it to NAEP’s flaws; perhaps it was bad leadership at NCES; perhaps it was bureaucratic inertia—in any case, the result is that NAEP lagged in making needed improvements and adopting modern testing technologies. Underneath all this, there was a growing risk aversion by contractors and NCES to change, turning NAEP’s gold standard sobriquet into a lead anchor.
This risk aversion was never more apparent than in the last round of bidding for the government contracts to conduct NAEP. At that time, the independent scientific research institute RTI International led a consortium of high-quality companies that would have produced a better, cheaper NAEP. While the consortium scored high on technical merits, it lost the competition because a panel of government employees viewed the risks of changing the NAEP machine as too high.
NAEP’s Missing Innovations
NCES’s overly cautious approach to NAEP has caused the test to lag other large-scale assessments when it comes to adopting new technologies. Here are two concrete examples.
Researchers demonstrated that computer-automated scoring of student responses was reliable and cost-effective as far back as 2011. Today, more than 20 states use automated scoring, combined with human scoring. This approach ensures accuracy while reducing costs and increasing scoring speed. But only just now is NAEP implementing this technology, after spending years and millions of taxpayer dollars on hand scoring.
Advances in artificial intelligence have made possible automated item generation that works just as well as—if not better than—creating questions manually.
Beyond scoring, NAEP has also lagged in the way it generates test questions. The traditional way of generating questions is an expensive, labor-intensive, time-consuming manual process. Advances in artificial intelligence have made possible automated item generation that works just as well as—if not better than—creating questions manually. Several states and private-sector testing companies have adopted this approach to save time and cut costs. NAEP, however, is playing catch-up—not where a gold-standard assessment should be.
NAEP Scores Are Hard to Understand
There are also problems with the way NAEP data are presented to the public. Figure 1 shows the typical way in which NAEP results are reported, using national scores for reading and math in grade eight.
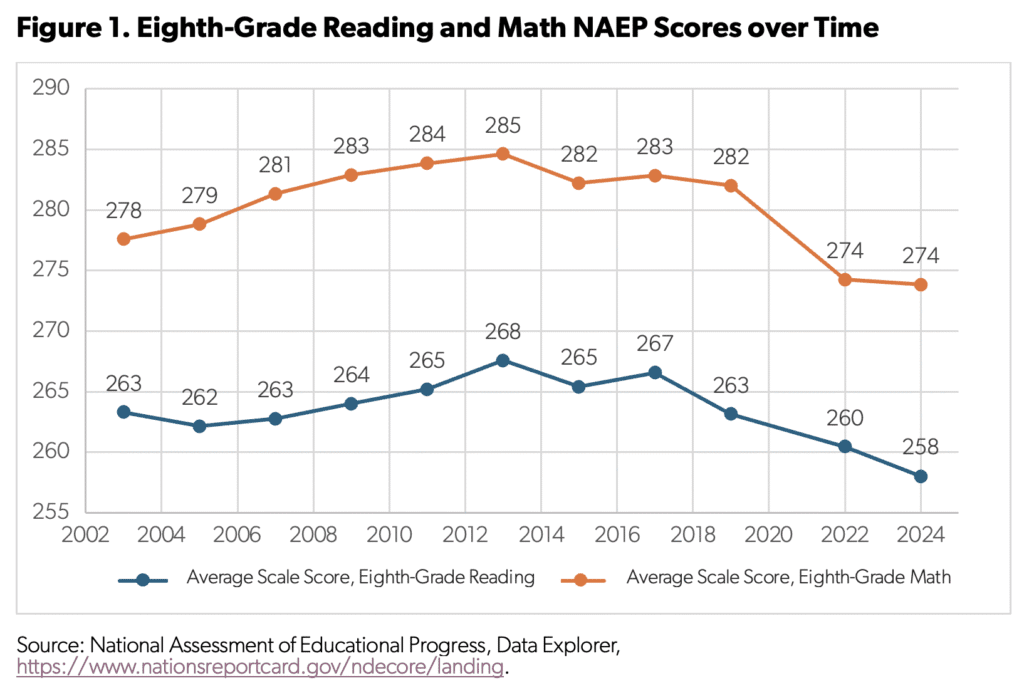
The y-axis on this chart ranges from 255 to 290, representing a “scale score” for NAEP. To most people, these scores mean next to nothing. That’s because scale scores have no real-world referent that makes them intelligible.
It doesn’t have to be this way.
In fact, several teams of researchers already repackage NAEP data in far more accessible ways. For instance, the Education Recovery Scorecard translates changes in NAEP scores into months and years of learning loss—a far clearer reporting of student achievement. While there are a lot of technical details behind all this, the result is easy to grasp—and a lot more meaningful than NAEP’s scale scores. (See Figure 2.)
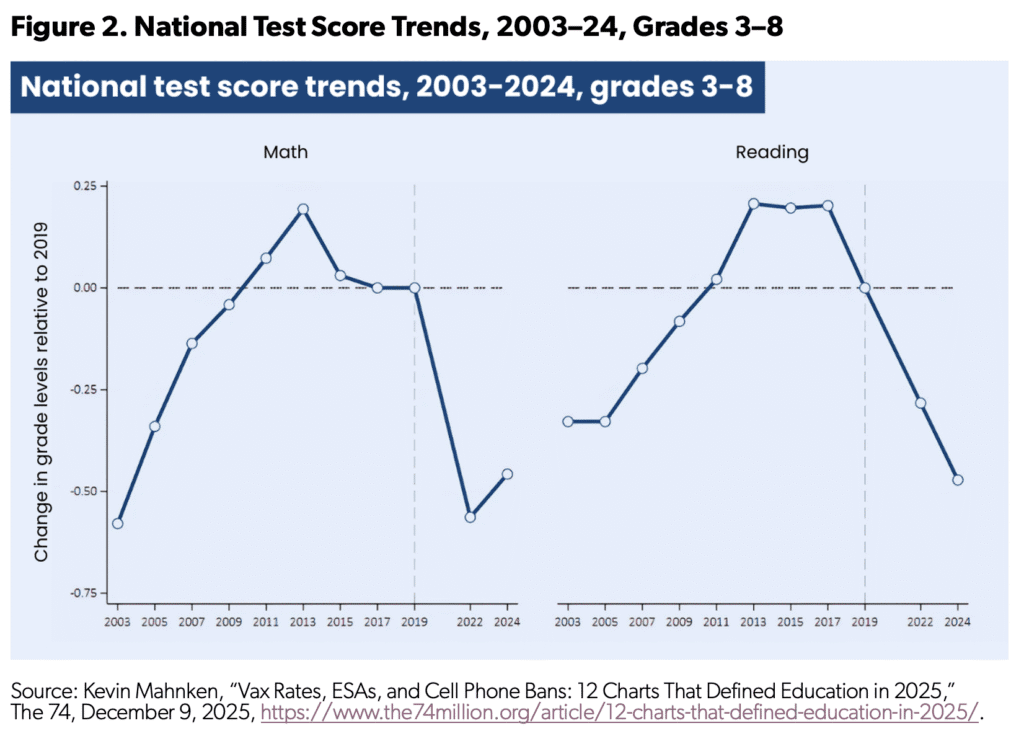
Focusing on the years immediately before and after the pandemic, the Education Recovery Scorecard estimates that in reading, eighth-grade students lost almost half a year of learning between 2019 and 2024. For eighth-grade math, the learning loss was even larger in 2022, bouncing back a bit in the 2024 NAEP assessment.
There are trade-offs involved in making these translations. Most notably, converting NAEP scores into months of learning requires making assumptions about an equivalent rate of growth, and the new measure may not adequately capture the differences in the rates of learning for different groups of students. These problems are real, but they are measurement questions that can be subject to rigorous testing and to which researchers, particularly those at Stanford and Harvard, have found solutions.
Clarifying When Differences in NAEP Scores Are Actually Important
The way NAEP reports differences in scale scores across years should also change. Because NAEP samples are so large, conventional tests of statistical significance add little value: Even small changes in scores are routinely deemed “significant,” despite having little or no educational importance. This interpretation flows from traditional statistical training, which emphasizes guarding against mistaking random variation for real change. Analysts rely on p values, for which results below 0.05 are labeled “statistically significant.”
Given how they are calculated, p values go down as sample size goes up. Because NAEP’s sample size is nearly half a million students, one- or two-point score changes from one administration to the next—typical differences between tests—almost always clear the bar for being labeled “significant,” even when they represent little meaningful change in learning.
A city and a state might experience the same score change, yet only the state’s result is reported as significant—simply because its sample is larger.
Conversely, large differences over time for smaller subgroups do not clear the bar, so they are labeled “nonsignificant”—even if they are two to three times the size of significant differences in larger populations. This problem also affects comparisons across jurisdictions of different sizes. A city and a state might experience the same score change, yet only the state’s result is reported as significant—simply because its sample is larger.
NAEP should explore ways of moving away from a simple binary test of statistical significance and toward quantifying how meaningful observed changes are.
Tapping into NAEP’s Treasure Trove of Data
Another challenge—and opportunity—for NAEP is figuring out how its data can be responsibly linked to other data sources so that NAEP scores are better understood in students’ real-world contexts. Meeting this challenge will require rethinking how NAEP data are accessed and used.
As AI transforms more sectors of our society, one thing is clear: Generative AI is only as valuable as the data used to train it. High-quality, relevant, large-scale data are essential. In education, such data are rare, located in different systems, uneven in quality, and often inaccessible. NAEP is an exception.
Taken together, NAEP’s data holdings include hundreds of thousands of samples of student work linked to information about students, their schools, and their communities. These data could support AI-enabled research with ambitious and practical goals: identifying common mathematical misconceptions, improving feedback on student writing, analyzing patterns in civic reasoning, and better understanding how family, school, and community factors shape achievement.
In short, NAEP’s taxpayer-funded data hold substantial untapped potential to improve research, inform educators, and ultimately strengthen student outcomes. If NAEP is to remain relevant in an era of data-driven research and artificial intelligence, it must evolve into a streamlined, efficient, and modern research program that preserves privacy while enabling innovation.
Revamping the NAEP Data Explorer
Right now, most people view and access NAEP data via the Nation’s Report Card website and the NAEP Data Explorer (NDE). The report card site presents only a fraction of the data available, includes mostly static presentations of data, and requires lots of scrolling, clicking, and wading through dense text to find simple answers. NDE is similarly inaccessible.
Again, it doesn’t have to be that way. NAEP could work with modern technology companies to make the NDE more useful. Imagine, for instance, using ChatGPT to get a simple chart showing how black students in Georgia perform over time compared with the nation or a neighboring state. NCES and NAGB should explore working with such companies to modernize how Americans access NAEP’s data rather than relying on the “same old, same old” troika that dominates NAEP.
Conclusion
The silver lining to NAEP’s shortcomings is that many more people know it is outdated. On January 30, NAGB released its plan for “Next Gen NAEP,” promising to “modernize and improve” the assessment. While the announcement was light on detail, the website did list the members of its advisory committee, including many highly competent researchers who understand how NAEP can be improved. This development inspires hope that NAEP will become better, even before its current contracts end in 2029.
There is no doubt that NAEP should be preserved—but not by pickling it in brine, preserving it as a 40-year-old relic. Rather, NAEP should be given a renewed charge to lead the nation in high-quality innovative assessment and earn back its right to be called the “gold standard.” This will require new thinking and a shift in the culture surrounding NAEP. Given the departure of so many NCES staff and leadership, this administration has an opportunity to do just that.
Mark Schneider is a nonresident senior fellow at the American Enterprise Institute, where his work focuses on education research and development. He was the director of the Institute of Education Sciences from 2014 to 2022 and commissioner of the National Center for Education Statistics from 2004 to 2008.